
Original research · Benchmark

Your second-largest expense is now your biggest competitive lever.

A CFO-focused benchmark on how cold storage operators are converting energy infrastructure into $12M+ of EBITDA recovery and immediate enterprise value — while their grid-dependent peers become acquisition targets.

No sales call required. PDF delivered instantly.

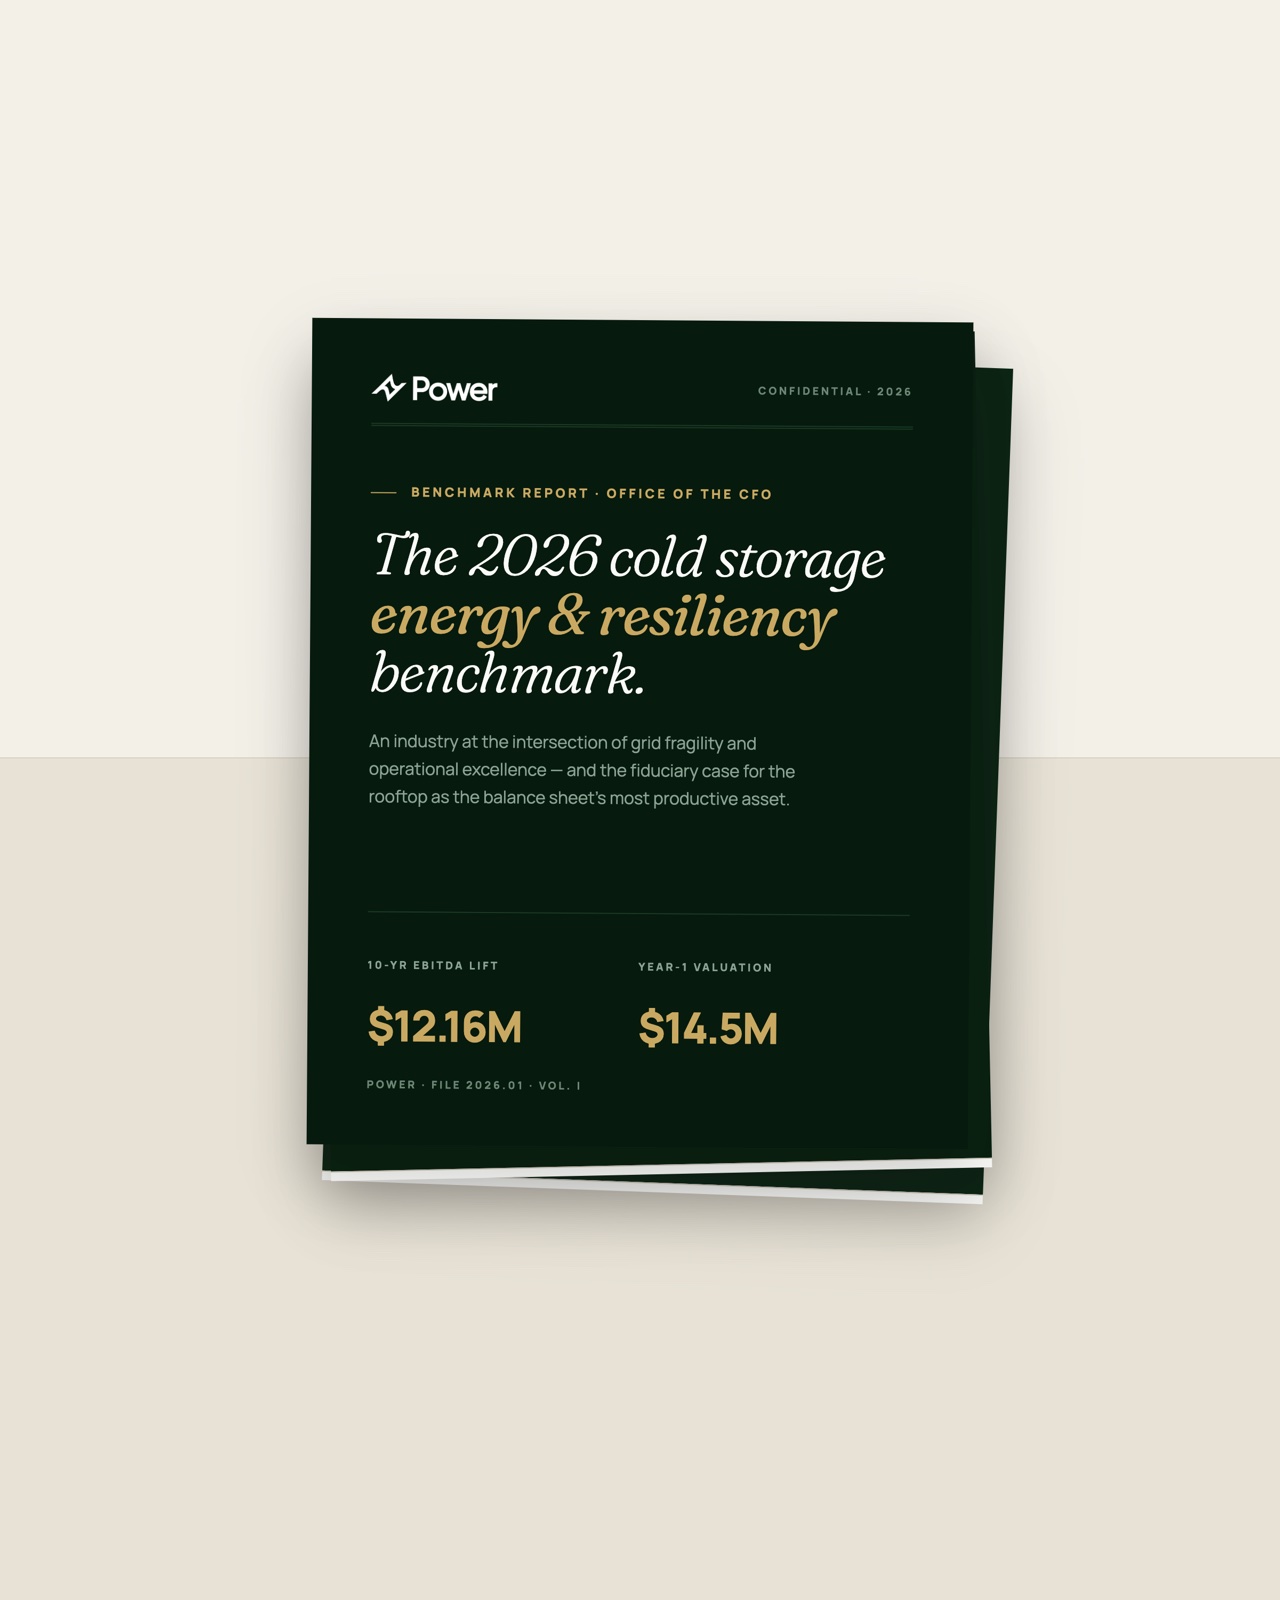
Cover of the 2026 Cold Storage Energy & Resiliency Benchmark report

Built on 2026 data from

PJM·FERC·EPA·Mordor Intelligence·Towards Healthcare·40+ facility audits

The headline findings

10-year EBITDA advantage
$12M+
Cumulative EBITDA gain over ten years of operation.
Immediate valuation lift
$14.5M
Day-one increase in asset value at a 6.25% cap rate.
Energy share of OpEx
60–70%
The cost base the program goes to work on.

The problem

The grid is no longer a utility. It's a competitor.

In 2026, three forces have permanently broken the energy model for cold storage — turning a line-item into an enterprise-value problem.

01 · Capacity at the cap

Record grid prices

PJM capacity prices cleared at the FERC-mandated cap of $329.17/MW-day — the highest in history.

02 · Outbid by AI

Data centers win the grid

Hyperscale AI data centers are outbidding industrial operators for grid capacity in every major logistics corridor.

03 · Surcharges climb

Rising no matter what

Delivery and distribution surcharges are rising 6–9% annually — regardless of how much electricity you actually use.

A refrigerated warehouse is an energy machine wearing a building. Energy runs 60–70% of total operating cost — roughly four times the electricity per square foot of a conventional warehouse, at about 24.9 kWh/ft² — and demand charges from refrigeration cycling can reach over 70% of the electricity bill. That concentration is a problem. It's also the opportunity: when one cost dominates the P&L, moving it moves everything.

The model

We built a representative refrigerated facility and ran it two ways: as-is on the grid, and with an integrated Power program — rooftop solar, behind-the-meter storage, demand-charge management, refrigeration efficiency, and backup. We then traced the difference not just to the utility bill, but all the way to EBITDA and enterprise value.

What we found

The integrated program turned the building's single largest cost into its single largest improvement. Over a ten-year horizon the modeled facility captured $12M+ in cumulative EBITDA advantage. Because that saving is permanent and recurring, it also reset the value of the asset itself.

  • Energy OpEx falls sharply and permanently — the saving doesn't erode, it compounds.
  • Demand charges, the least-visible line, drop the most through pre-cooling and storage.
  • Backup retires the spoilage risk that can write off a building of product in a single outage.

From savings to value

This is the part most energy analyses miss. A permanent reduction in operating expense flows dollar-for-dollar to net operating income. NOI is what the market capitalizes. At a 6.25% cap rate, the recurring saving translates into an immediate $14.5M lift in asset value — before a single new tenant or contract.

Energy savings don't just cut a bill. They build value.

For an owner-operator, that's NOI and asset value. For a 3PL or operating company, the same dollars lift EBITDA, and the multiple the business trades at does the rest.

Method & assumptions

The figures above are from a modeled representative facility, not a single named site, and are intended to illustrate the economics rather than guarantee a result. Actual outcomes depend on utility rate structure, roof and site characteristics, refrigeration profile, available incentives, and financing. The full report documents every assumption — and our 30-minute working session produces the numbers for your specific building.


What's in the report

Not a vendor whitepaper. A benchmark.

Written for the Office of the CFO — built on current PJM auction data, EPA AIM Act requirements, 2026 federal tax provisions, and field audits across the cold chain.

01 · Pro-forma

10-Year Alpha vs. Laggard

A full financial model comparing grid-dependent and energy-optimized facilities across cost-per-kWh, EBITDA lift, and cap-rate-adjusted valuation.

02 · Demand charges

The Demand Charge Trap

How a single 15-minute spike can set the floor for an entire month's utility bill — and what to do about it.

03 · Storage

The Thermal Battery Strategy

How operators use their own frozen inventory to arbitrage peak utility rates and cut grid dependence by up to 40%.

04 · Tax

2026 Tax Arbitrage Framework

Stacking the 30% ITC with Domestic Content and Energy Community adders for credits up to 50% — plus MACRS depreciation and transferability.

05 · Roadmap

24-Month Fiduciary Roadmap

A phased implementation plan that captures tax benefits within the current fiscal cycle without interrupting loading-dock throughput.

06 · Diagnostic

The Alpha Audit Questionnaire

A diagnostic tool to identify which facilities in your portfolio are most exposed to demand-charge risk.

Who it's for

Written for the people responsible for the answer.

If you're being asked to justify why energy infrastructure should compete with automation, fleet, or expansion capex — this report gives you the math.

Finance

CFOs & VPs of Finance

At cold storage operators, 3PLs, and pharma logistics companies.

Real estate

Heads of Real Estate & Asset Management

At REITs holding industrial cold assets.

Operations

Operations & Engineering Leaders

Evaluating capex priorities for 2026–2027.

Capital

Private Equity & Infrastructure Investors

Underwriting cold storage acquisitions or platform investments.

Get the benchmark

The full report, free.

Enter your work email and the PDF is yours instantly — read it, share it with your board, draw your own conclusions.

  • The complete 10-year Alpha vs. Laggard pro-forma model.
  • The demand-charge, thermal-battery, and tax-arbitrage playbooks.
  • The 24-month fiduciary roadmap and the Alpha Audit Questionnaire.
  • No sales call required. The report is a benchmark, not a brochure.

Instant PDF download. No spam, ever.

300+ MWOn-site capacity deployed
1,200+Facilities powered
$2.2B+Lifetime power savings
10 yrsIn business
Trusted by NABCEP Certified · Licensed & insured · Projects nationwide
Raising Cane's Culver's Sonic Drive-In U.S. Air Force